TrendBreaker_BigFishB
vip
Age0.4Year
Peak Tier6
No content yet
Market Analysis on August 12
——————————
$BTC is oscillating around the 30-minute center, returning to the center again, rebounding for a while in 5 minutes, and continuing to move downward to look for oscillation.
$ETH oscillates around the center for correction
Upward trend on the daily chart
Weekly upward trend
4 hours 1 hour 30 minutes rise to sideways
Focus on the center, look for long positions below the center.
The 1-hour 60 moving average has already retraced twice, and there is a space of 150 dollars for going long.
The 3 4-hour MACD has formed a death cross at a high level and is movi
BTC-0.98%
ETH4.07%
View Original
post-image
post-image
  • Reward
  • 1
  • Repost
  • Share
MarketLadyvip:
Good information
They are all unhappy to show.
Showing it doesn't prove anything.
#BTC#
BTC-0.98%
View Original
post-image
post-image
post-image
  • Reward
  • 1
  • Repost
  • Share
GateUser-91a8f82avip:
Just go for it💪
Market Analysis for August 10
There’s nothing to analyze, just keep being bullish.
ETH daily chart fifth wave, the extended third wave operation within the fifth wave.
Fourth wave pullback (waiting 1 hour, 30-minute 52 moving average, buy in batches ), after the pullback, the fifth wave reaches the peak, target historical high.
Sold all spot positions that broke the previous high and walked away to avoid risks.
BTC accurately retraced to the 1-hour 52 moving average and started to break out and rise.
My trading system is the moving average, simple and clear.
#BTC#
ETH4.07%
BTC-0.98%
View Original
post-image
post-image
  • Reward
  • 3
  • Repost
  • Share
MakeMoneyByDeliveringvip:
Hold on tight, we are about to To da moon 🛫
View More
Market Analysis for August 9
$BTC is in a weak oscillation with key support at 115500.
$ETH is strengthening, indicating a divergence in capital. The view on Ethereum is that this position is a major fourth wave correction. After the pullback is completed, breaking above 4000 is inevitable. Additionally, currently starting from 1380, it is running in the fifth wave on the 4-hour chart. Using the third wave to measure the fifth wave, the target area is around 4800-4900. This is just a prediction.
Looking at the 15-minute, 30-minute, and 1-hour charts, the price has been running above the 60-per
BTC-0.98%
ETH4.07%
View Original
post-image
post-image
post-image
  • Reward
  • 12
  • Repost
  • Share
TrendBreaker_BigFishBvip:
You are really lively.
View More
Market analysis for August 8
$BTC 4-hour breaks through W bottom, key support 115500
The upward trend is clear in 1 hour.
$ETH 4-hour bottom breakout 1-hour trend around the moving average is clear. You can wait for the fourth wave pullback to enter a long position.
$XRP bullish at 2.8 bottom, 20 points so far
$UNI 1-hour trend is clear, bullish
Summary: The current 1-hour trend is clear, and we are in the 3rd wave of movement, which tends to extend. Be patient and wait for this wave to finish; do not hastily enter a short position. Continue to hold low-position long positions, and consider re
BTC-0.98%
ETH4.07%
XRP-1.36%
UNI5.56%
View Original
post-image
post-image
post-image
  • Reward
  • 2
  • Repost
  • Share
TrendBreaker_BigFishBvip:
On the 11th, the 1-hour 52 moving average was given.
View More
Market Outlook for August 6
————————
Summary: Long position strategy for BTC
1 Break above 115800, forming a clear 30-minute buy without breaking new lows, go long.
2 Break below 111850, then pull back to 111850 to form a false breakdown 2B long.
ETH 30-minute bottom V reversal, key neckline around 3520, consider going long if it re-establishes above the 60 moving average on the 1-hour chart, following Bitcoin.
It is important to note that if Bitcoin quickly rebounds after hitting a new low, Ethereum may not necessarily hit a new low. Ethereum's rebound is stronger than Bitcoin's.
Ethereum 15
BTC-0.98%
ETH4.07%
View Original
post-image
post-image
  • Reward
  • 11
  • Repost
  • Share
MoXiaoYingvip:
Just go for it💪
View More
Market Analysis on August 5
——————————
Yesterday we mentioned that Bitcoin faced resistance at 115800, peaking at 115720, and then it fell 📉.
ETH also reminds that after the bottom fractal, there will be a 30-minute second buy signal, currently running.
ETH is rebounding strongly, with three daily candlesticks forming a strong bottom pattern. Pay attention to a pullback on the 30-minute chart, with a small-level indication of a stop in the decline. Continue to go long.
#BTC # BTC#
BTC-0.98%
ETH4.07%
View Original
post-image
  • Reward
  • 1
  • Repost
  • Share
GateUser-b2b74737vip:
1
Summary of the review on August 4
————————
Since going long near the W bottom neck line yesterday, the price hasn't seen a strong surge, but I still maintain a bullish outlook for a rebound.
Starting from the moving average trading system, go long on a 5-minute golden cross, as long as the price does not break below the 15-minute 60 moving average, hold on.
Find signals in 5 minutes, hold positions for 15 minutes, and focus on larger trends with smaller trades.
The price has not broken below the 60-period moving average on the 15-minute chart, and there has just been a strong surge.
XRP has be
XRP-1.36%
ETH4.07%
UNI5.56%
BTC-0.98%
View Original
post-image
post-image
post-image
post-image
post-image
  • Reward
  • 5
  • Repost
  • Share
GateUser-74684fafvip:
nice
View More
Yesterday, we looked for a Rebound long order near the neckline of the 15-minute head and shoulders.
Clearly state to go long on Xrp ETH BTC
XRP is currently up 5 points.
ETH from 3430-3510
BTc is only 1000.
Today, the small timeframe is fluctuating above the 60 moving average on the 15-minute chart.
Many assets have not broken below the 15 moving average in the past hour. This strong oscillation is also aimed at repairing the distance of the MACD on the 30-minute, 1-hour, and 2-hour charts to the zero axis. Today, I continue to look for a Rebound.
#以太坊十周年# BTC#
XRP-1.36%
ETH4.07%
BTC-0.98%
View Original
post-image
  • Reward
  • Comment
  • Repost
  • Share
Market Analysis on August 3
——————————
🎉🎉🎉🎉🎉🎉🎉🎉
$BTC
The posts from a few days ago mentioned that BTC is paying attention to the 60-day moving average on the daily chart. It has perfectly retraced to the 60-day moving average on the daily chart.
Currently, a W bottom has appeared on the lower level, and the last segment of the downward structure with 5 waves has been completed. At this position, a rebound is anticipated, with the rebound area being between 114800 and 115800.
The later trend follows the purple and yellow routes. Considering that the MACD red bars on the 4-hour chart a
BTC-0.98%
ETH4.07%
XRP-1.36%
CRV-1.21%
View Original
post-image
post-image
post-image
post-image
post-image
post-image
  • Reward
  • 1
  • Repost
  • Share
Digitalfanivip:
good morning I am a very happy birthday to you my sweet friend
July 14 Morning Analysis
——————————
🎊🎊🎊🎊🎊🎊🎊🎊
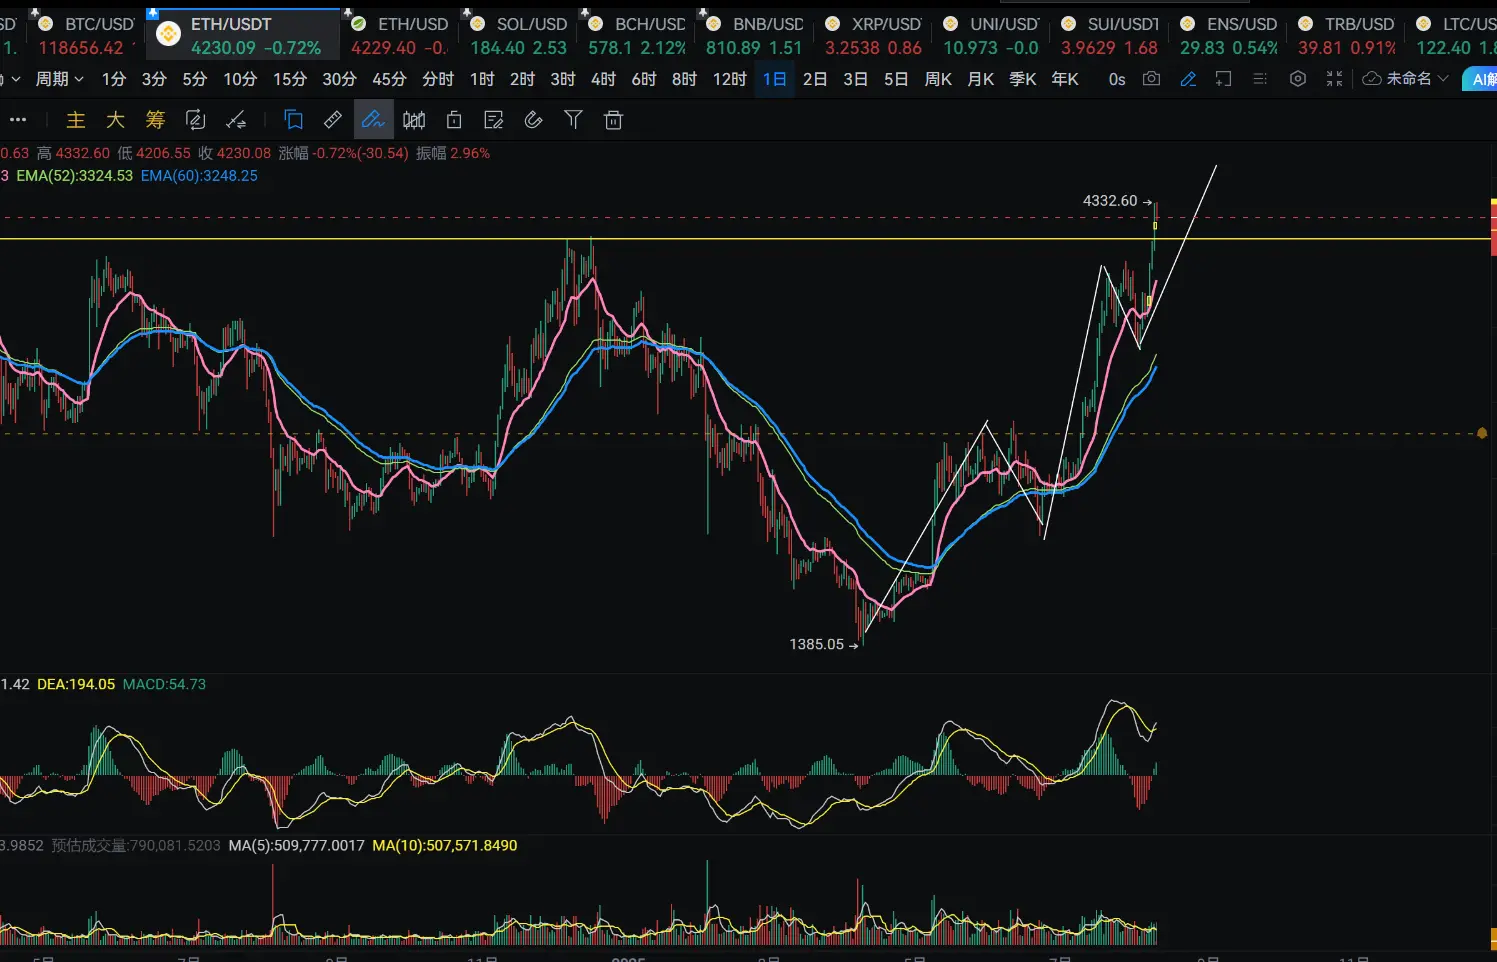
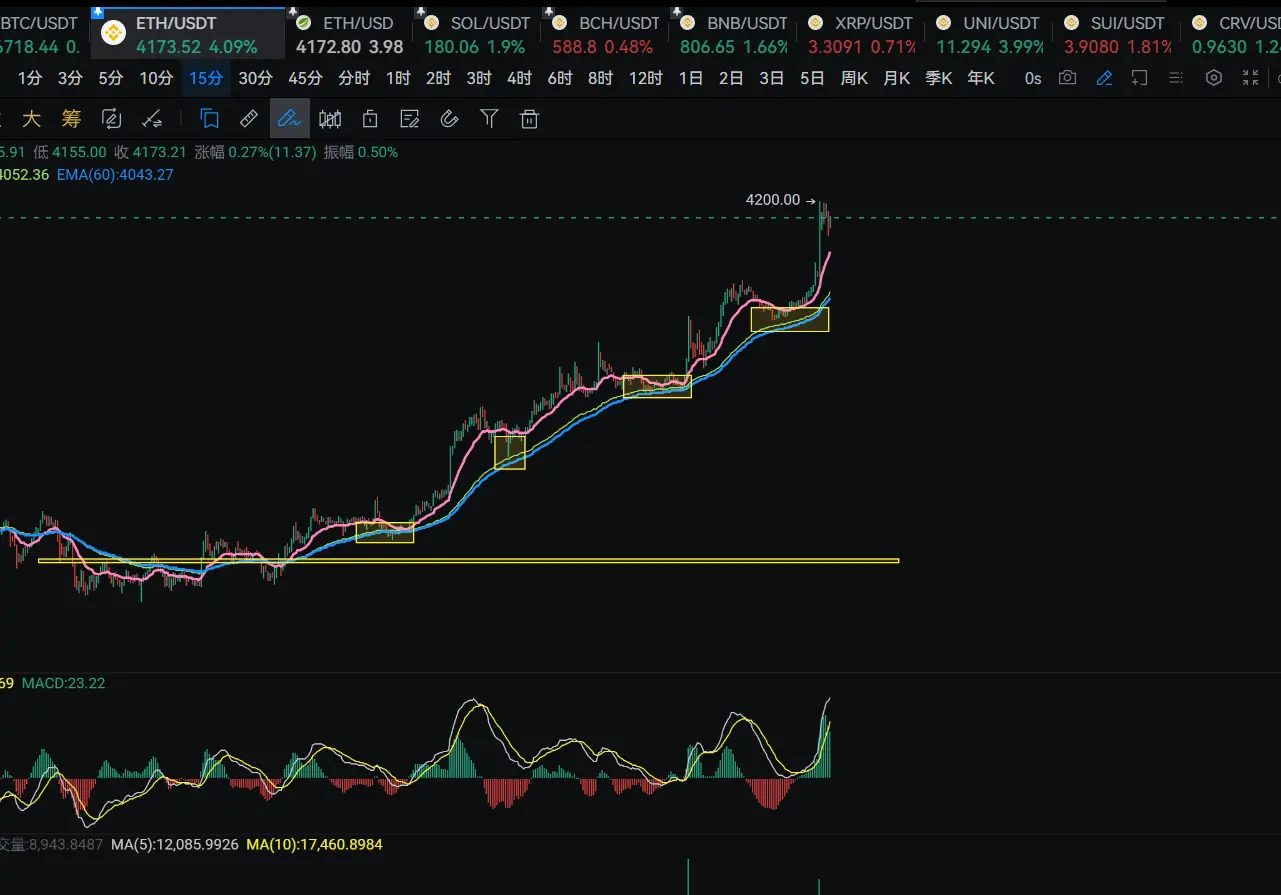
Monthly upward trend Weekly upward trend ( two bullish candles ➕ one special star, indicating a new high )
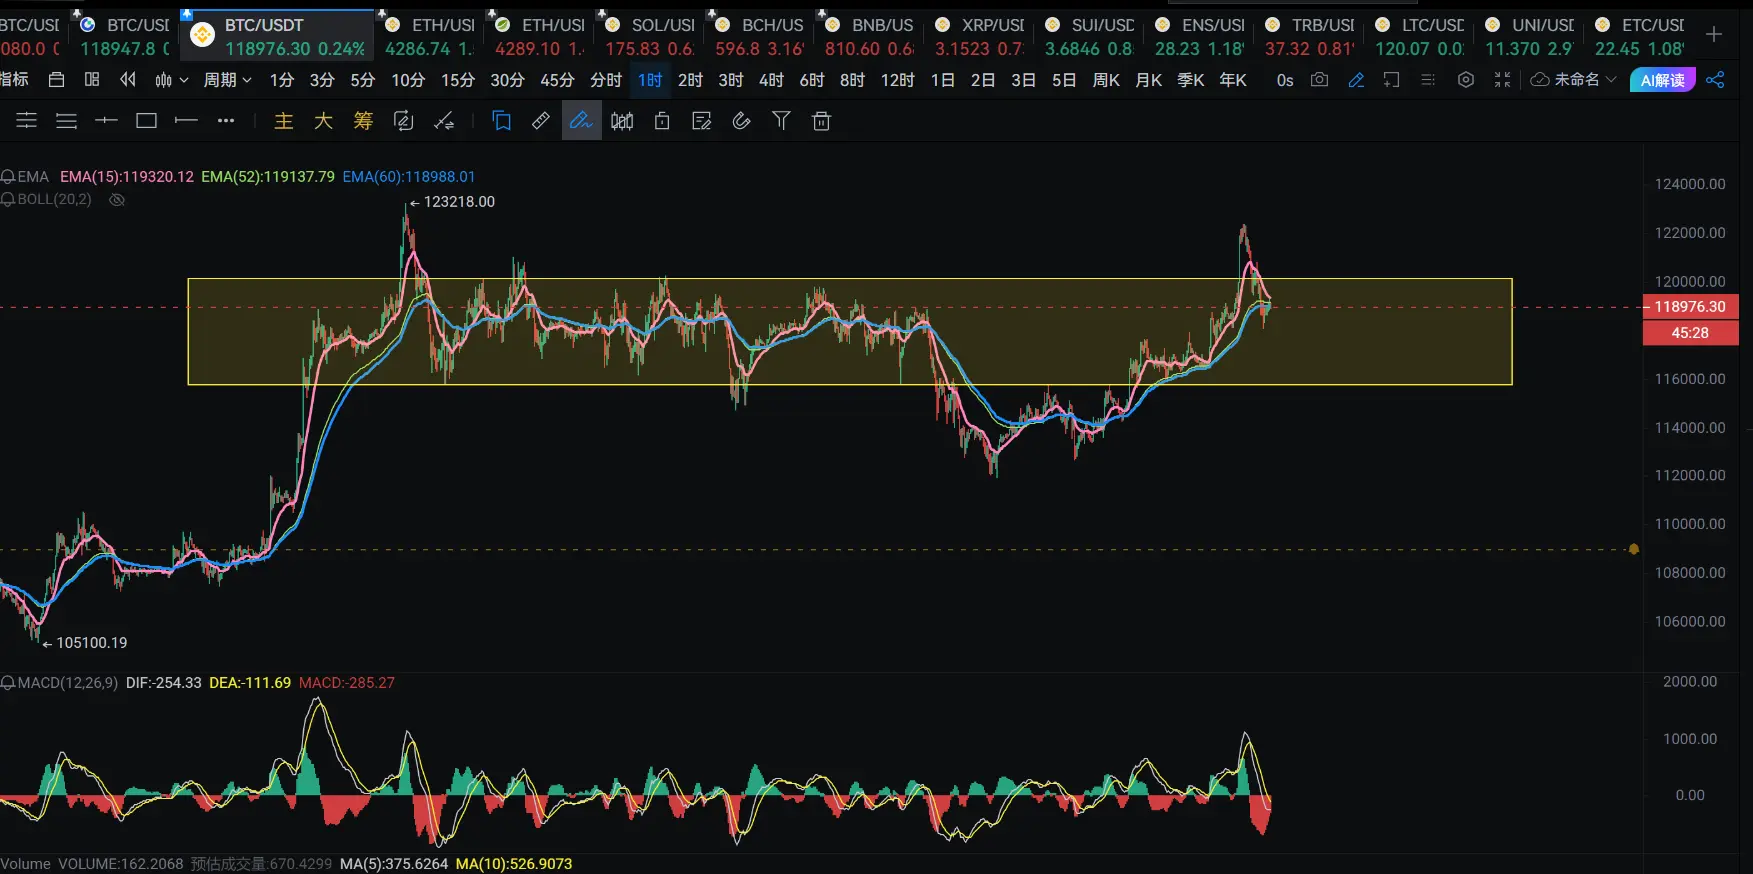
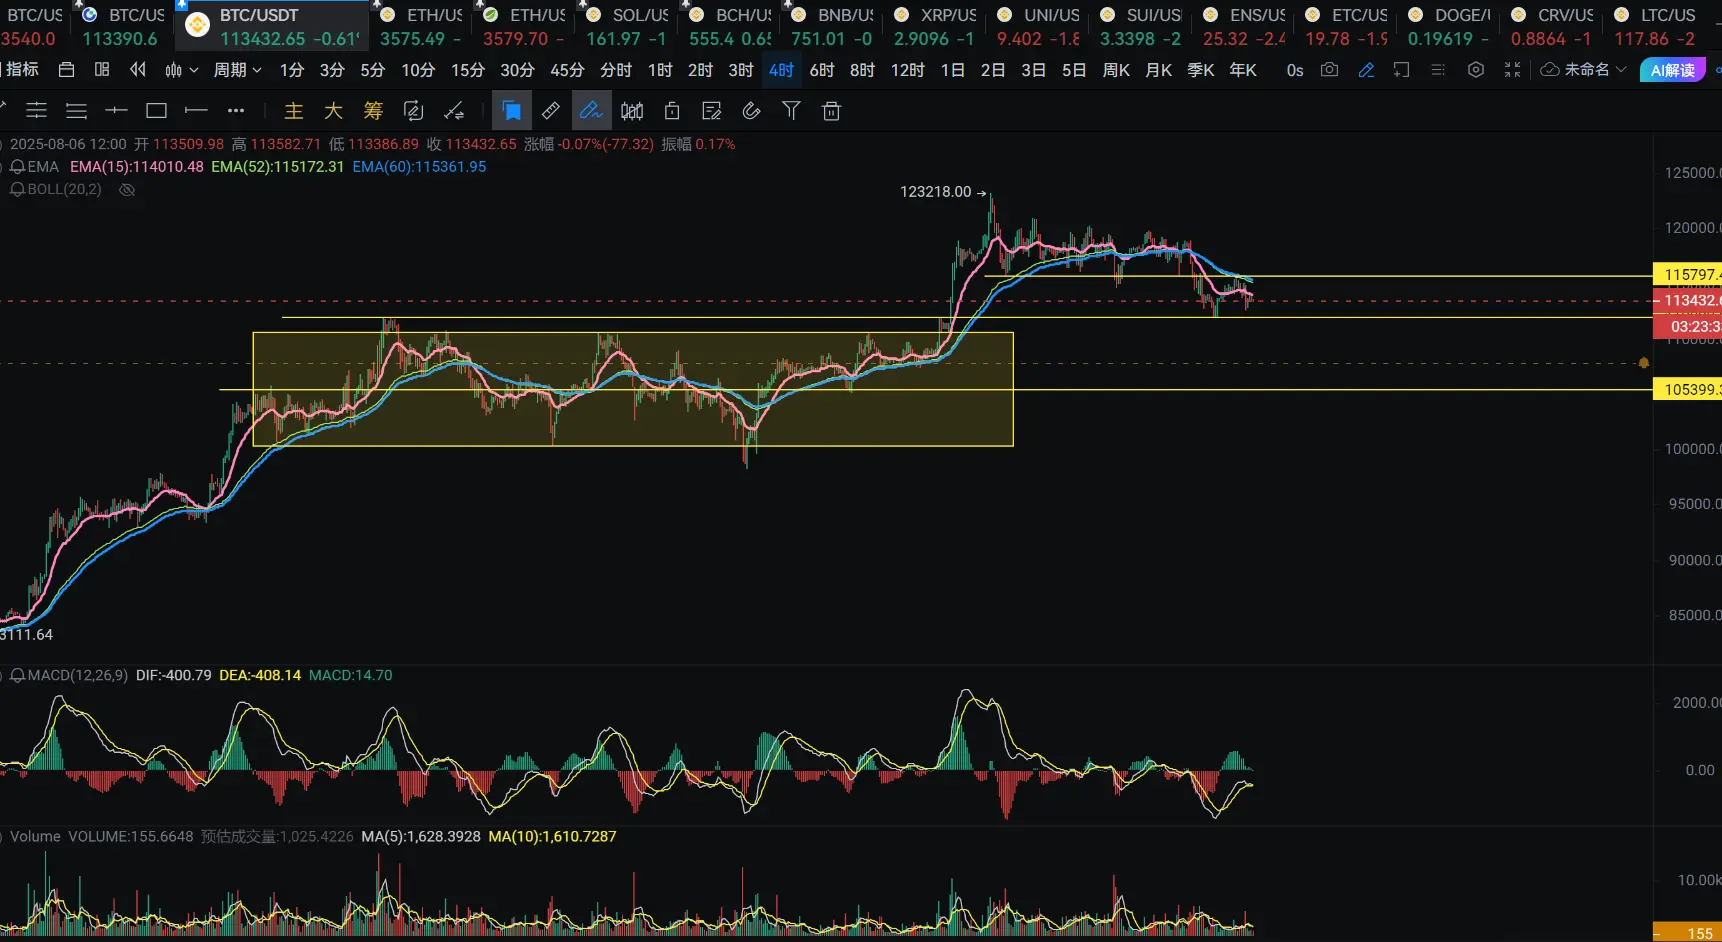
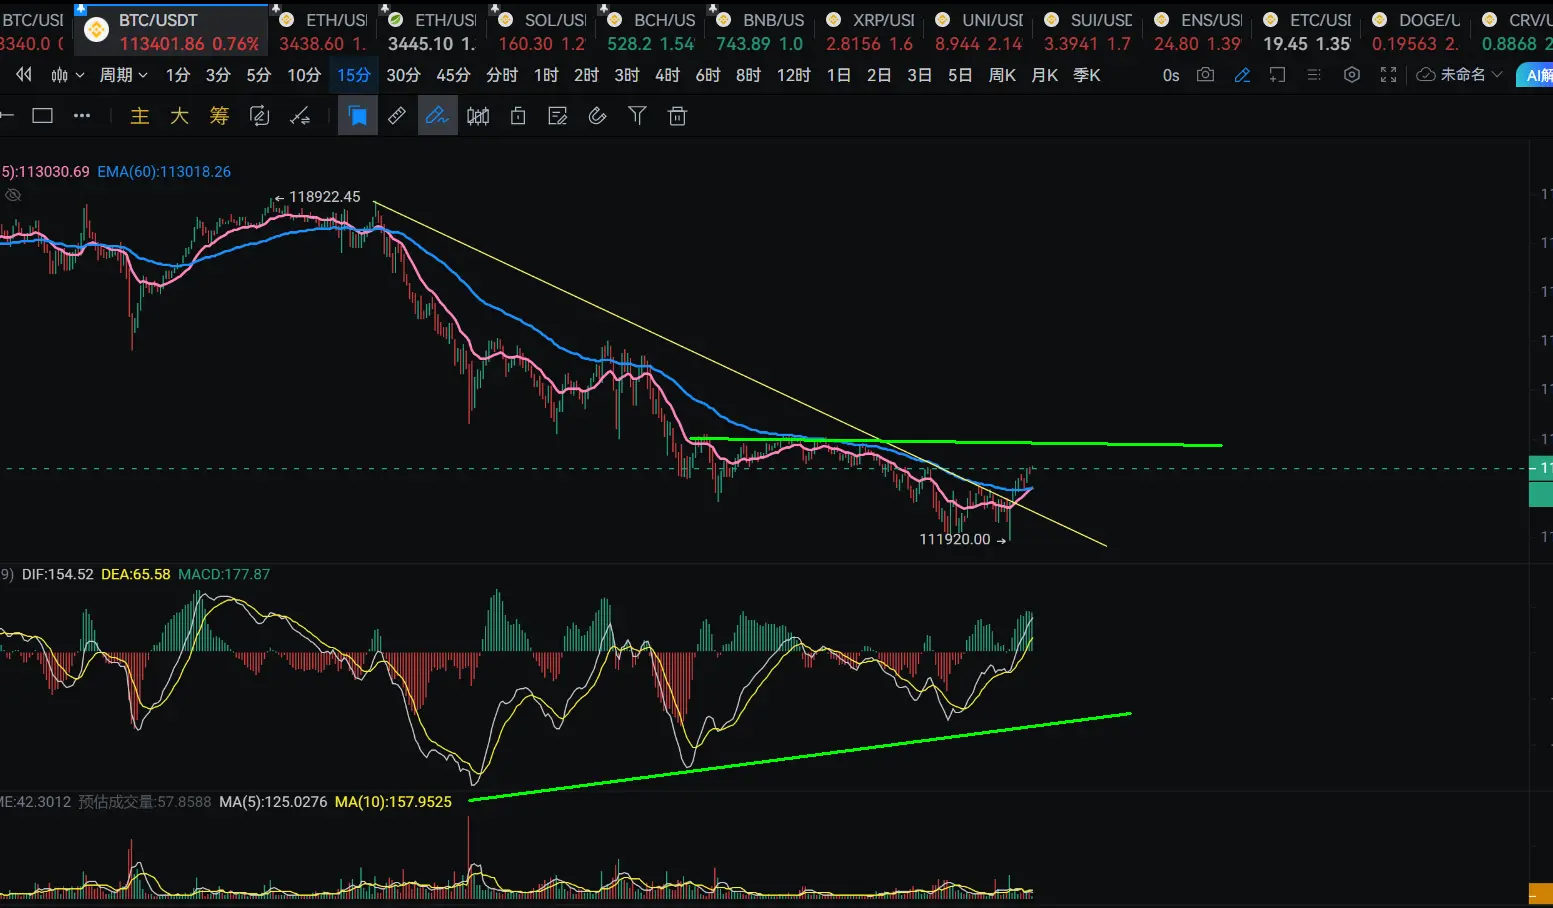
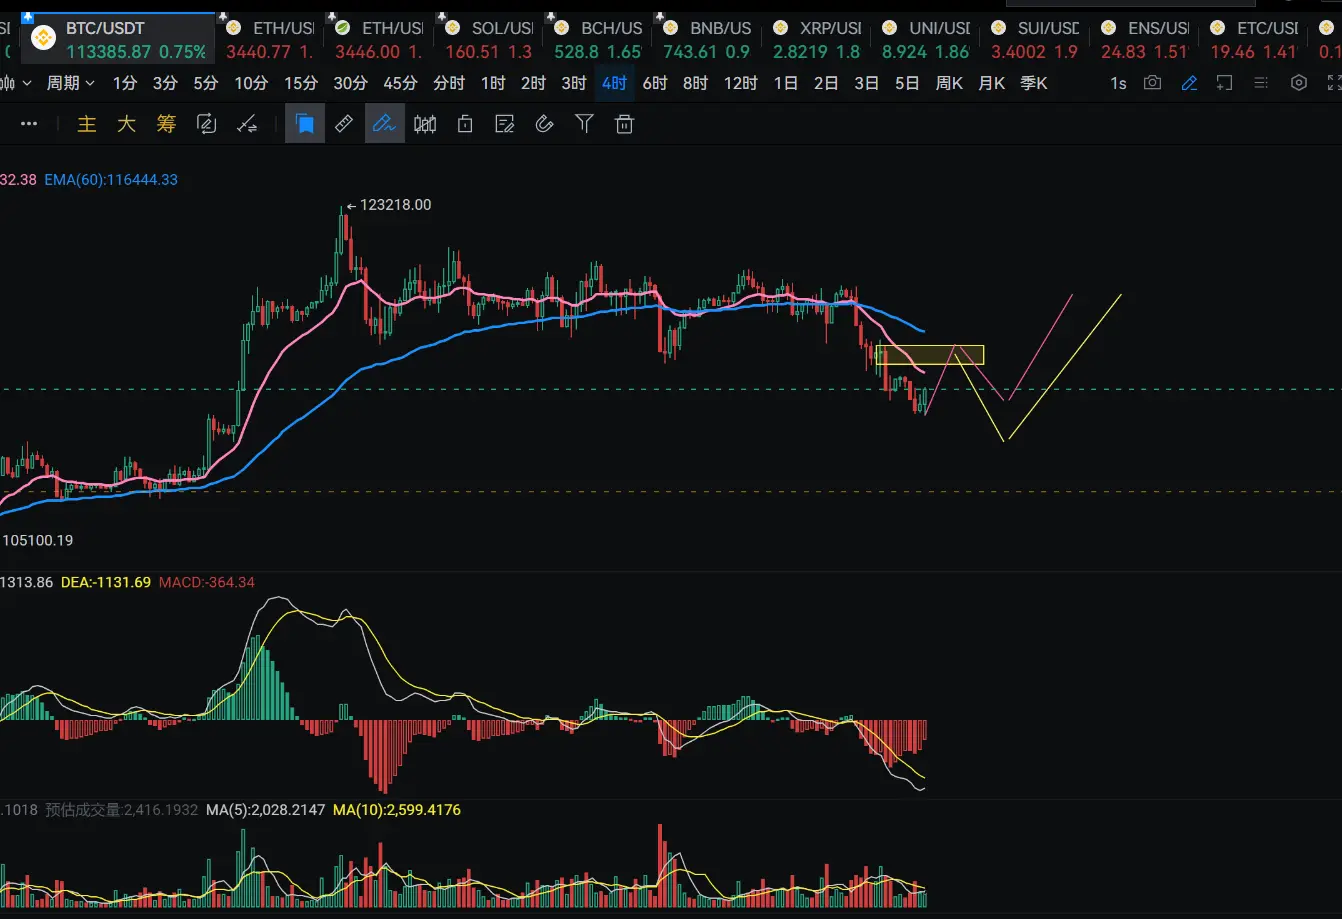
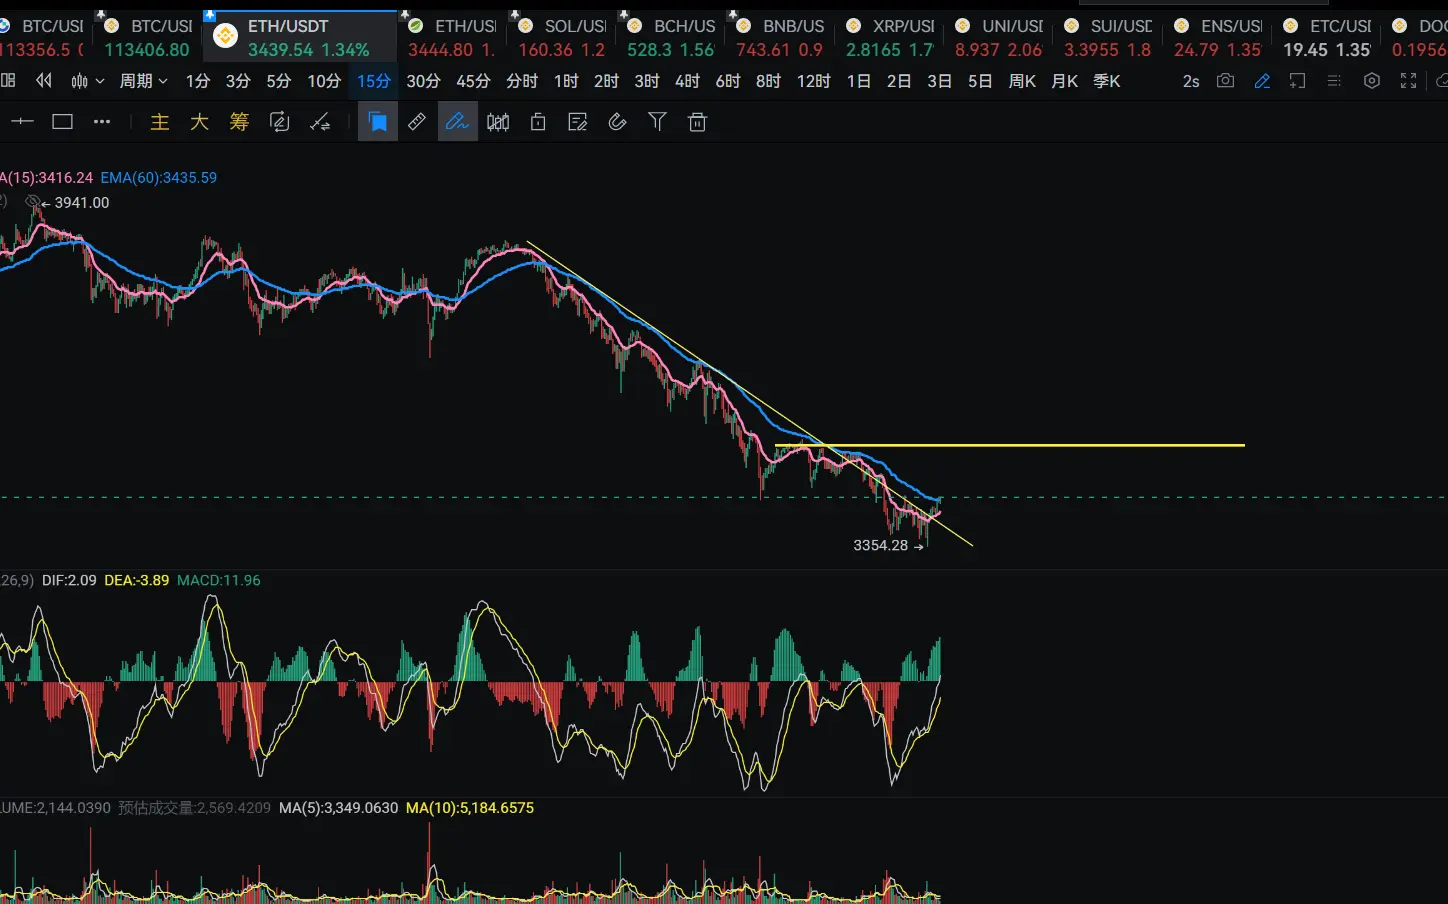
Daily MACD solid green, 4-hour MACD solid red, indicating a sideways market.
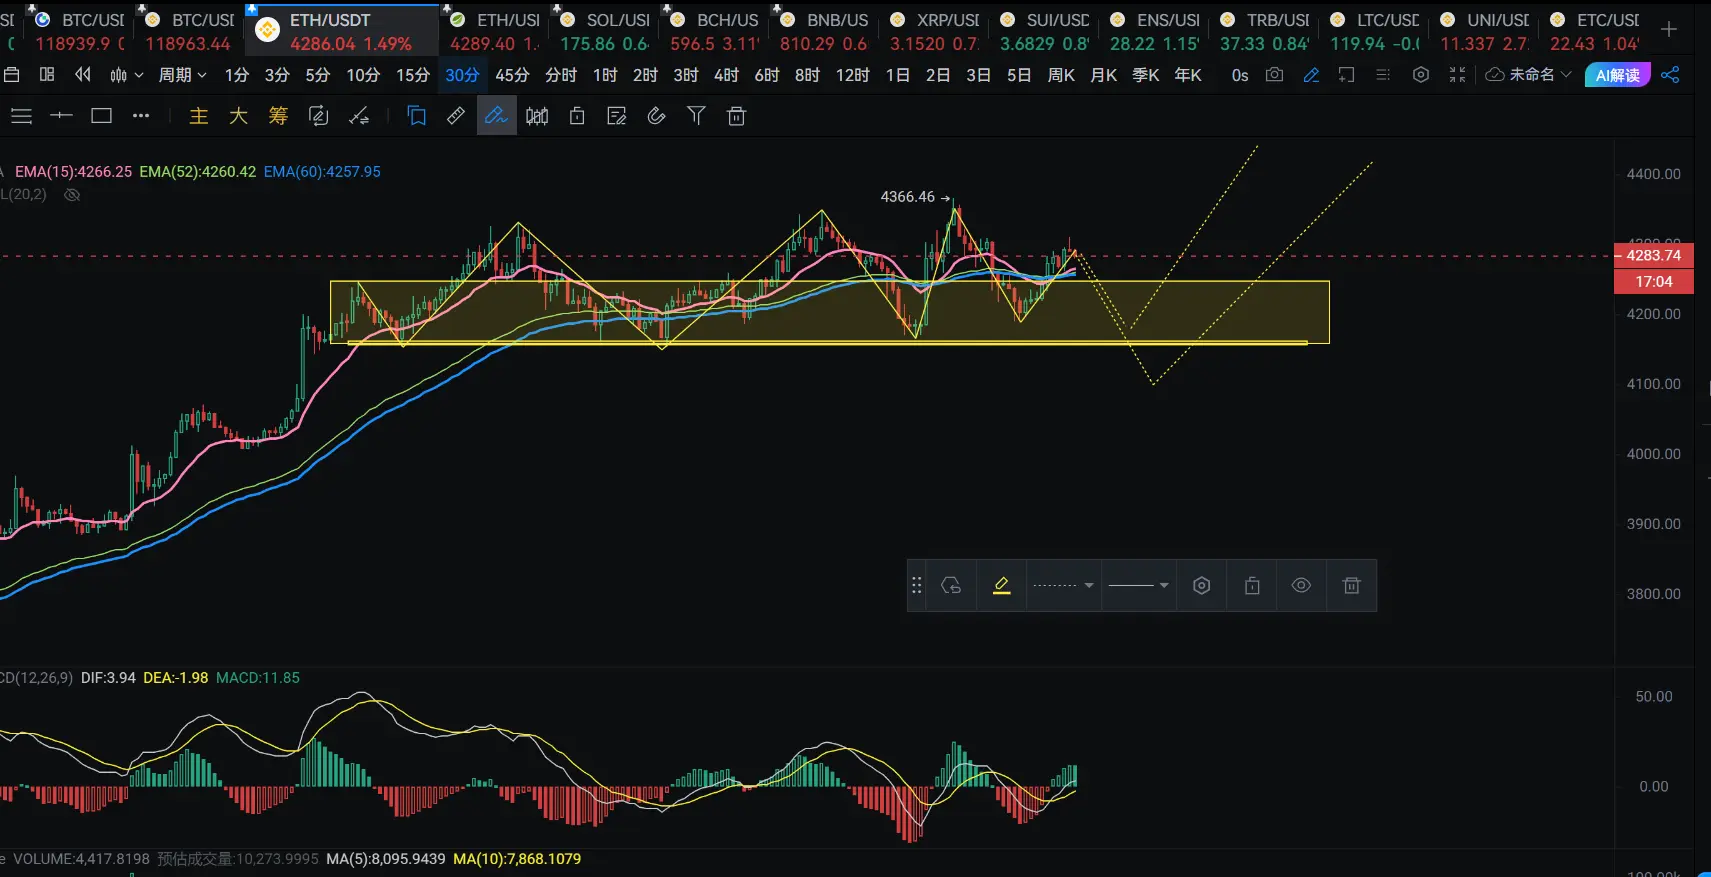
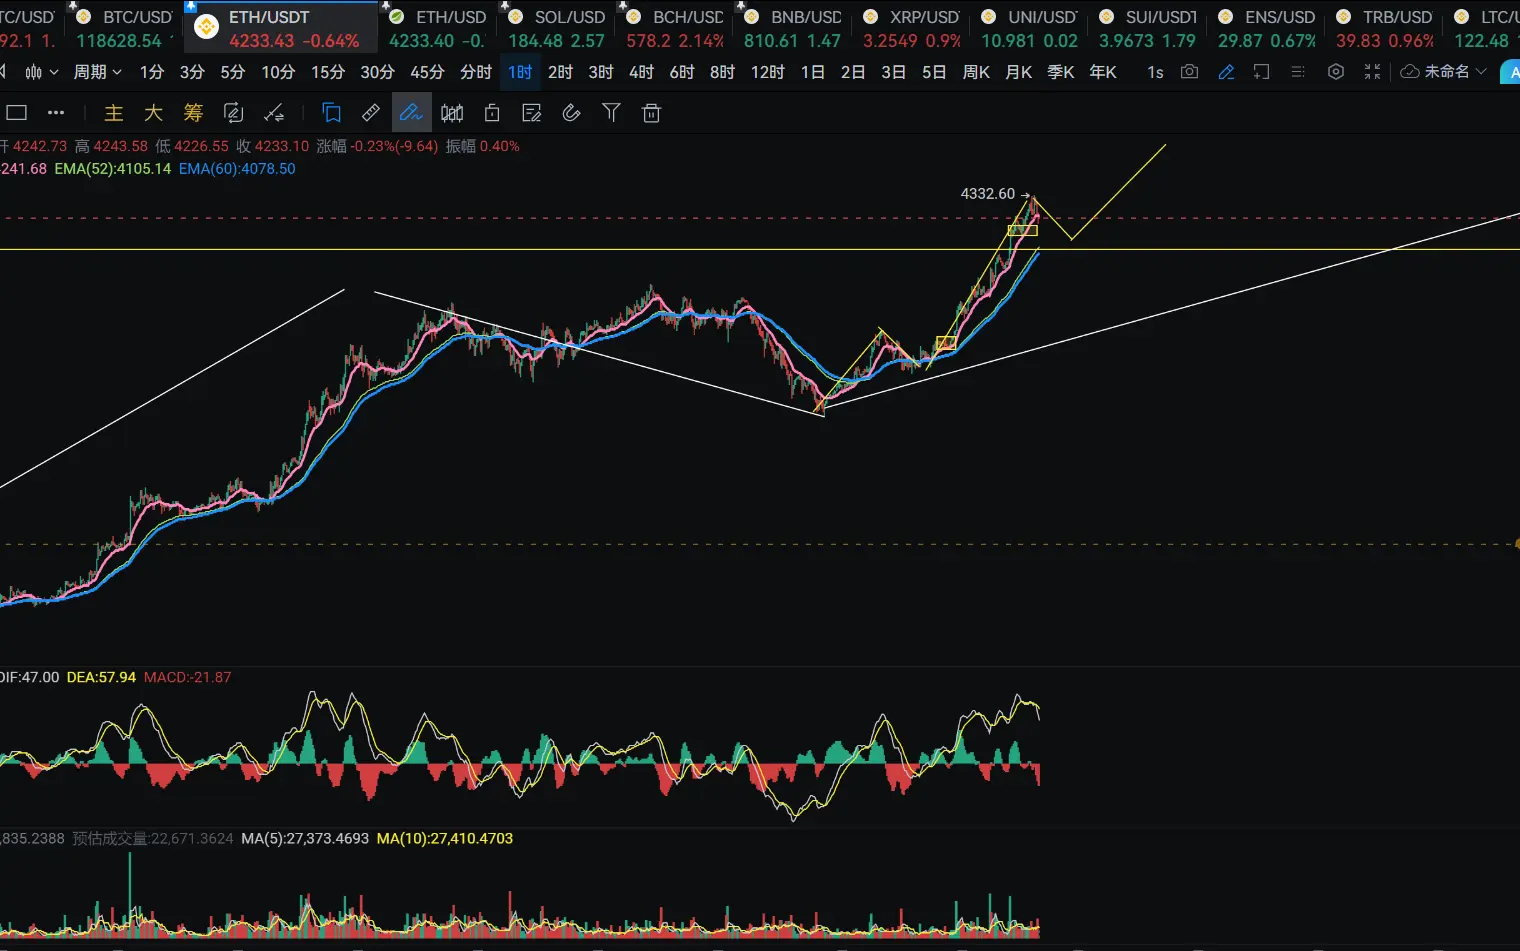
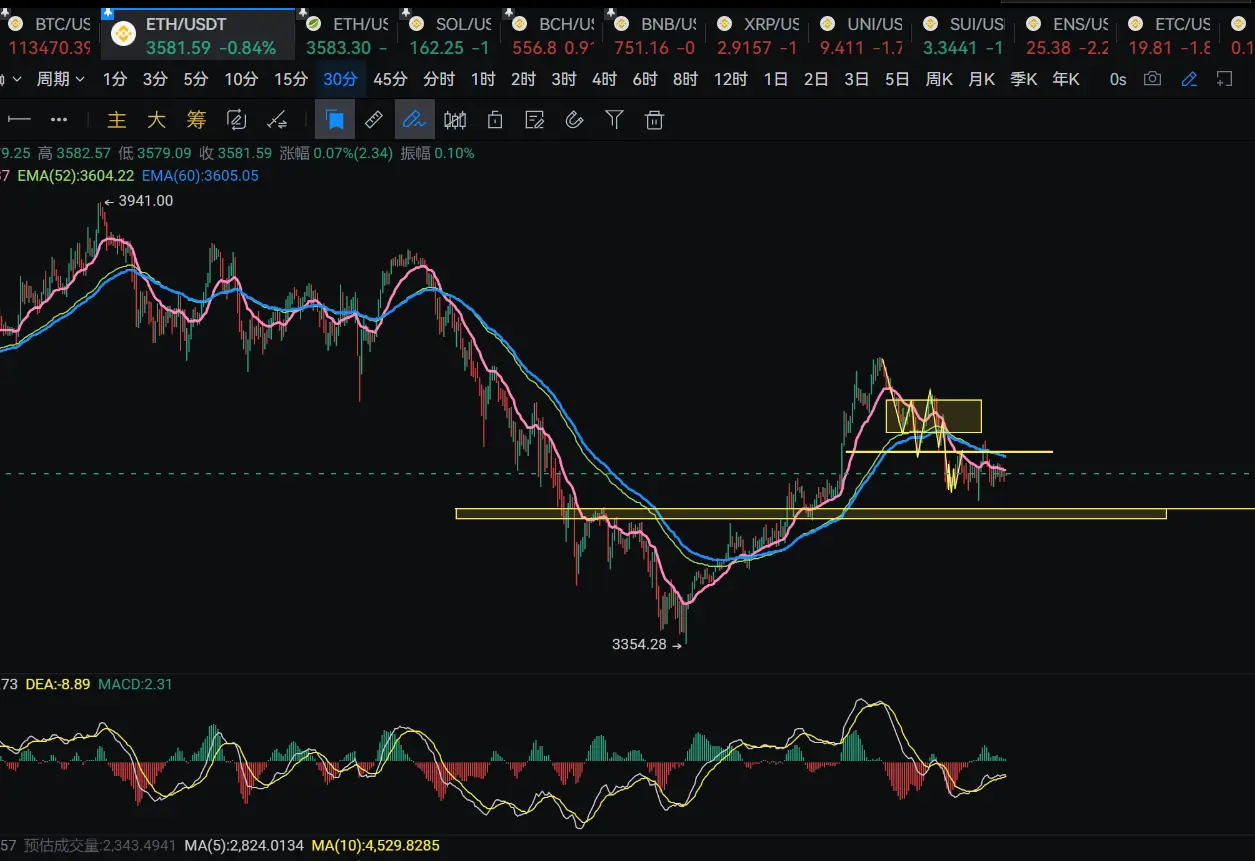
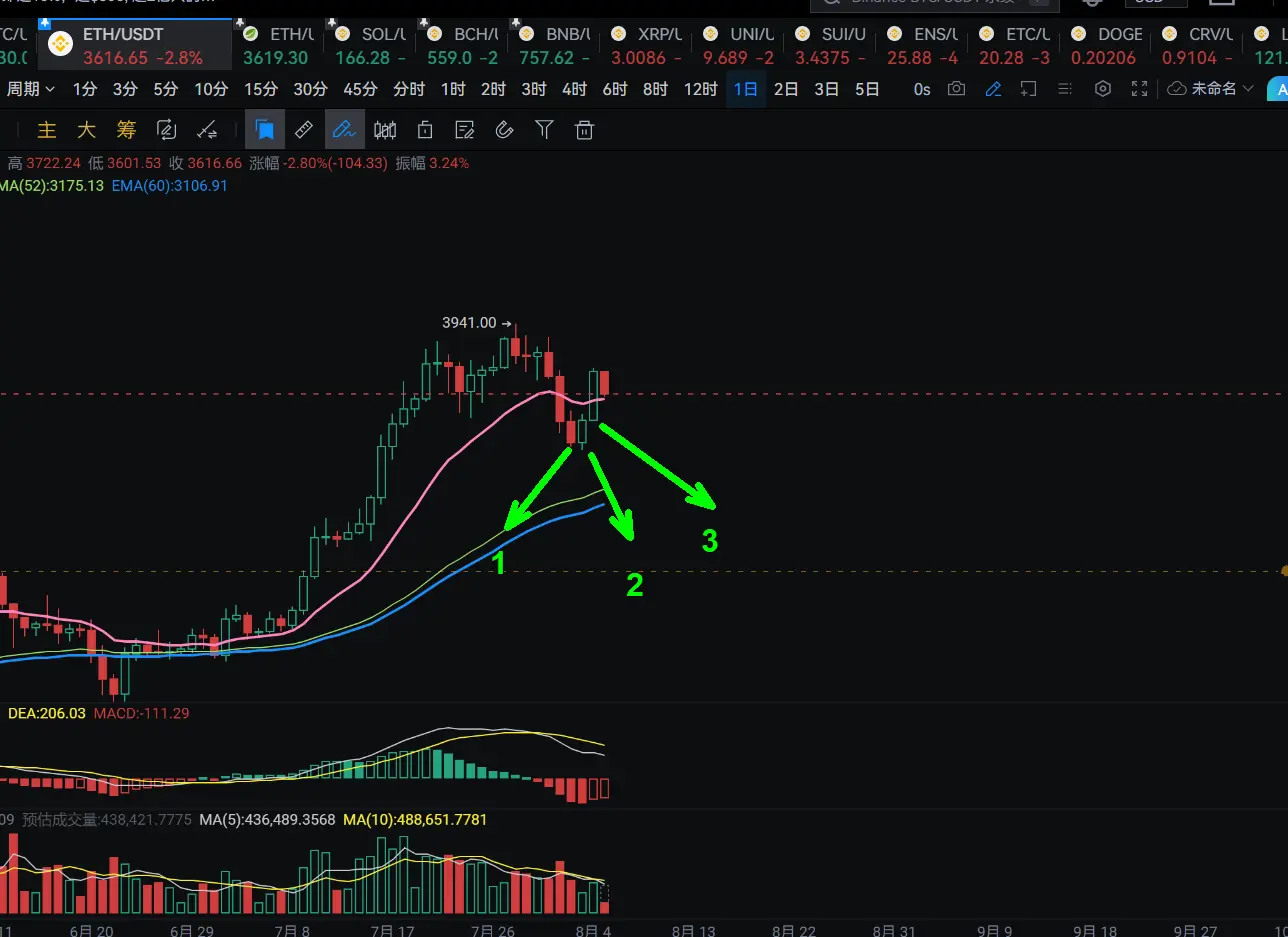
In 4, 6, and 8 hours, the MACD is at a high position, indicating a need for a dead cross repair. The market adjustment time is insufficient, and there is still a need for central oscillation.
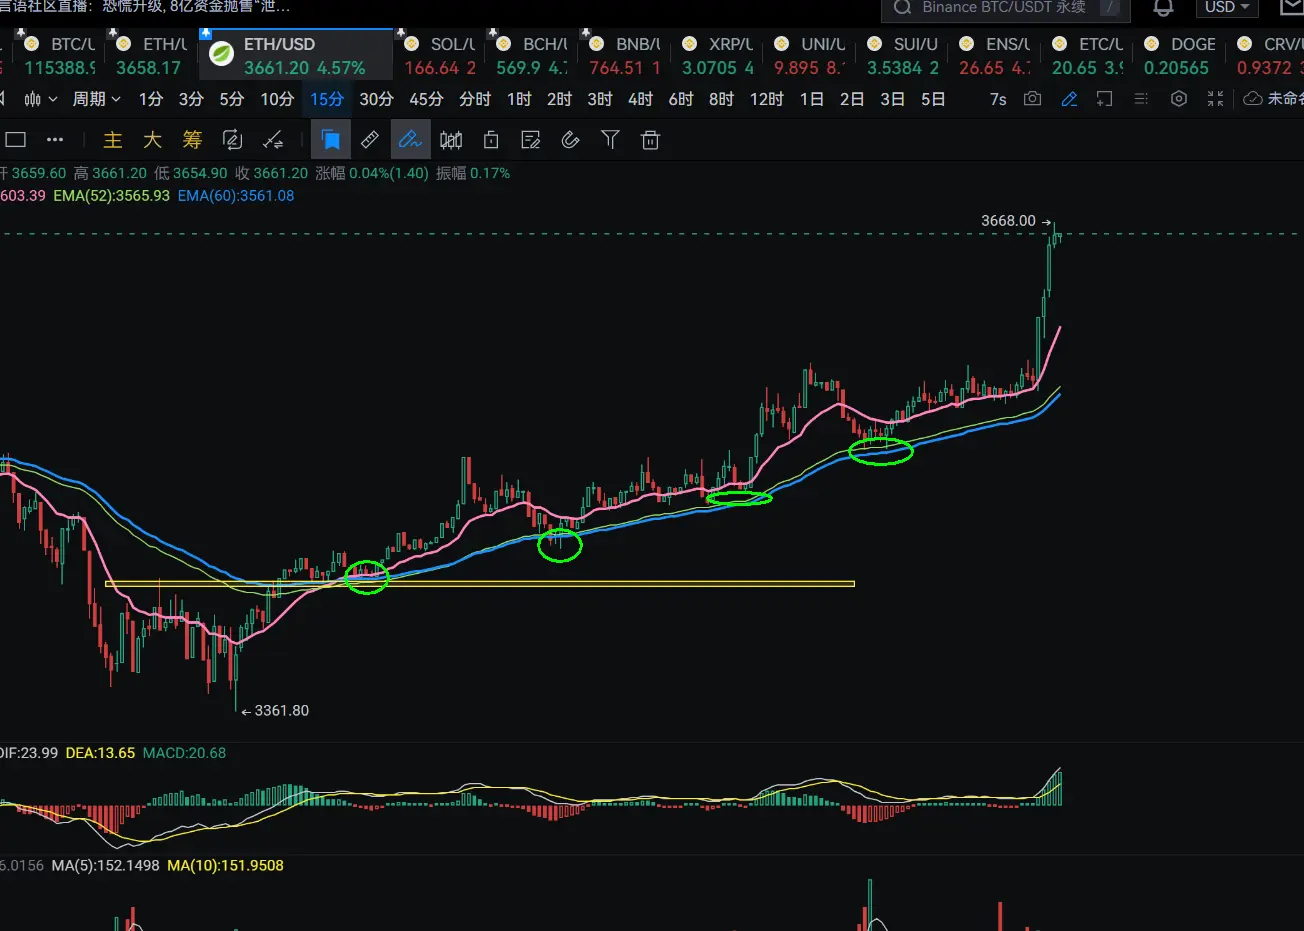
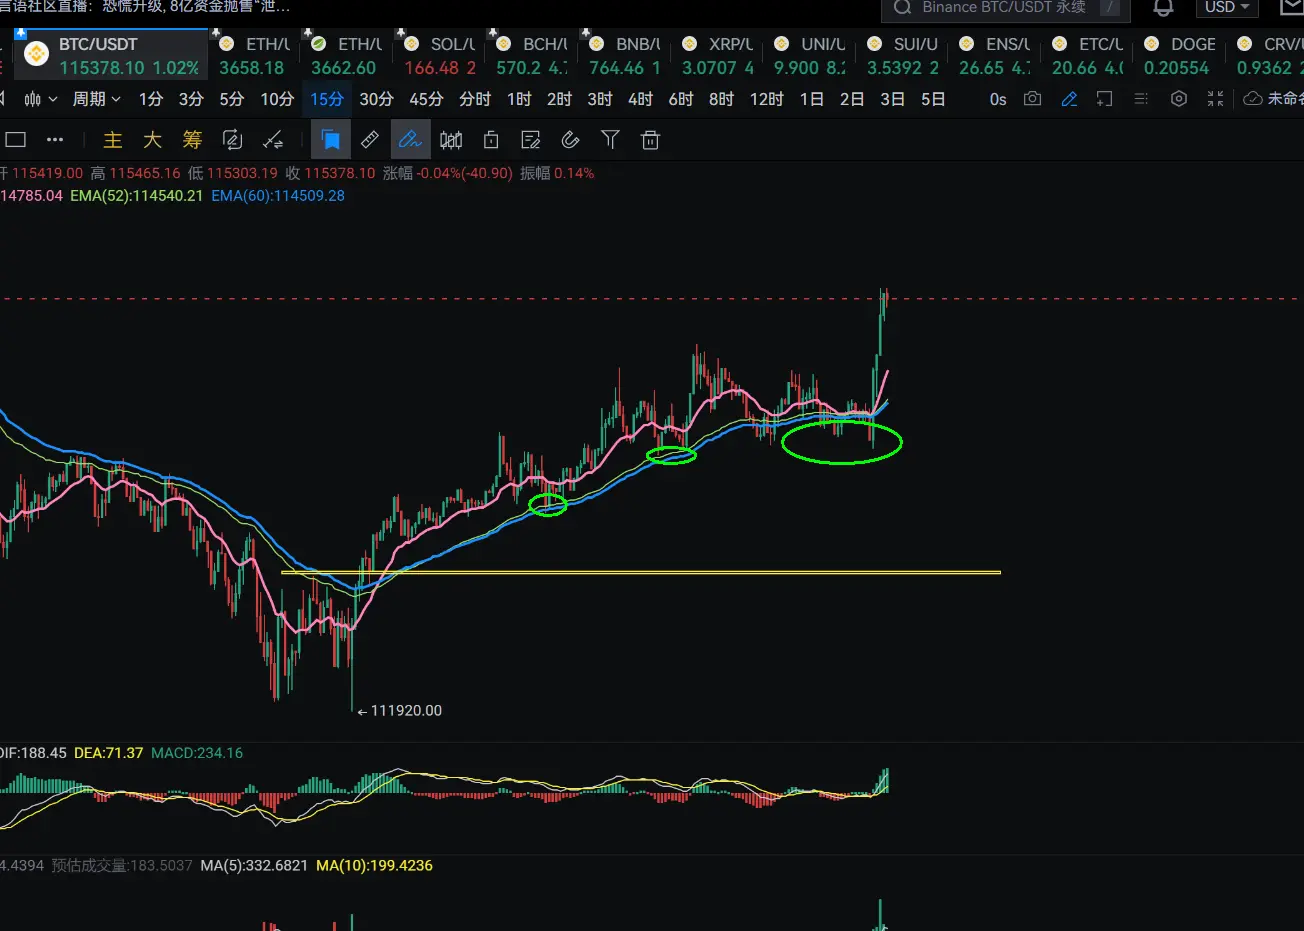
30 minutes of fluctuation around the center, short positions can be taken above the center, with a focus on strength in the 5-minute timeframe. Look for a top divergence t
BTC-0.98%
View Original
  • Reward
  • Comment
  • Repost
  • Share
About Centralized Reorganization
There is running, there is expansion, there is extension.
Whether it is an increase or decrease, it is triggered by the central hub.
Only after leaving will there be a market, identifying the center is very important in practical operations.
In the current 30 minutes, it is in the central axis.
BTC is oscillating around a 30-minute range, moving back and forth until a trend change occurs. The 3, 4, and 6-hour charts still need to correct, and it will return after leaving. It will go down and then come back up, correcting back and forth.
The long position has be
BTC-0.98%
View Original
post-image
post-image
post-image
post-image
  • Reward
  • Comment
  • Repost
  • Share
July 8th market data summary
——————————
🎊🎊🎊🎊🎊🎊
The triangle pattern fluctuates, transitioning from sideways to trend; just need to patiently wait.
However, in the market data within a sideways trend, one should enter and exit quickly, taking profits. Moving forward, focus on shorting if there is an effective breakdown followed by a pullback, and reconsider going long only after an effective breakout and retest. Additionally, it is a short-term long position (, as this position is at a high level. Attention should be paid to the strength of the breakout; otherwise, one might get caught at
ETH4.07%
SOL-0.7%
BTC-0.98%
View Original
post-image
post-image
post-image
post-image
  • Reward
  • Comment
  • Repost
  • Share
In the classroom live broadcast, it was mentioned that if 152.56 breaks out and then falls back, try a short order, set a stop loss and hold, to see if the trend can reverse. If a small moving average death cross appears on the 5-minute chart, continue to add if the large moving average does not appear. Stay still!
BTC-0.98%
View Original
post-image
post-image
post-image
  • Reward
  • Comment
  • Repost
  • Share
Going long near SOL149.5 during the live stream, currently in profit.

Stop loss can be set at 149.5 or 149.

Take profit between 152-154.5
#BTC#
SOL-0.7%
BTC-0.98%
View Original
  • Reward
  • Comment
  • Repost
  • Share
Market Analysis on July 7
————————————
🎊🎊🎊🎊🎊🎊🎊🎊
After the rise last night, a top divergence appeared on the 30 15-minute chart. Additionally, a 2B false breakout pattern emerged, and currently, the 5-minute EMA15 has crossed below the 60 moving average, breaking below the triangular structure at the 5-minute top. A pullback should be used to short, with a stop loss placed near 109300.
Similarly for ETH
Similarly for SOL
While boldly making predictions, be careful to verify them. Last night's surge may have formed a second sell signal in the 30-minute timeframe.
Short while keeping a go
B-4.46%
ETH4.07%
SOL-0.7%
BTC-0.98%
View Original
post-image
post-image
  • Reward
  • 1
  • Repost
  • Share
Bacteriumvip:
will crash
Market Analysis on July 6
——————————
🎊🎊🎊🎊🎊🎊🎊🎊
$BTC
Daily, Weekly, 4-hour, sideways movement in an upward trend, is a high-level consolidation.
The consolidation in the sideways trend during the 5-minute downtrend, with the second bottom test last night not breaking the new low, shows a narrow fluctuation.
Pay special attention to the neckline at 108500. If it breaks and retraces without entering, you can go long; otherwise, do not proceed. Alternatively, you can use the 5-minute moving average golden cross, and if it retraces without breaking below the longer-term moving average, you
SOL-0.7%
ETH4.07%
BTC-0.98%
View Original
post-image
post-image
post-image
  • Reward
  • 8
  • Repost
  • Share
TrendBreaker_BigFishBvip:
Have you entered a position?
View More
#BTC#
Summary of the evening of July 4
Busy outside today, no live stream. Based on the current market situation, let's talk about it.
$BTC Viewpoint
The current chart has broken the key neckline at 108500, do not blindly bottom-fish, and should remain cautious!
If the price returns to 108500, a long position should be taken. If it cannot hold above 108500, the focus should be on shorting near the neckline level on a pullback.
$ETH view
2520 is the high point of the previous consolidation zone, and it has now broken down, with the lowest point reaching 2498, in line with BTC's trend. If it can
BTC-0.98%
ETH4.07%
View Original
post-image
post-image
  • Reward
  • Comment
  • Repost
  • Share
  • Topic
  • Pin
Trade Crypto Anywhere Anytime
qrCode
Scan to download Gate app
Community
English
  • 简体中文
  • English
  • Tiếng Việt
  • 繁體中文
  • Español
  • Русский
  • Français (Afrique)
  • Português (Portugal)
  • Bahasa Indonesia
  • 日本語
  • بالعربية
  • Українська
  • Português (Brasil)