SwapCrypto
vip
Age0.6Year
Peak Tier0
No content yet
Ethereum Bull Flag Pattern Signals Potential Upside Breakout....!!
This ETH/USDT 2-hour chart reveals a classic Bull Flag formation, indicating possible continuation of the recent uptrend. The price is consolidating within the flag structure after a strong rally, with Bollinger Bands showing narrowing volatility suggesting an impending breakout. Volume patterns support the bullish thesis, while the red and green rectangles highlight key support and resistance zones where price action has previously reacted.
✨Entry: 3594.71
🎯TP1: 3701.19
🎯TP2: 3751.63
🎯TP3: 3916.95
🛑SL: 3471.41
ETH6.58%
RLY2.65%
post-image
  • Reward
  • Comment
  • Repost
  • Share
BNBUSDT 4H – Breakout Rally Loading 🚀
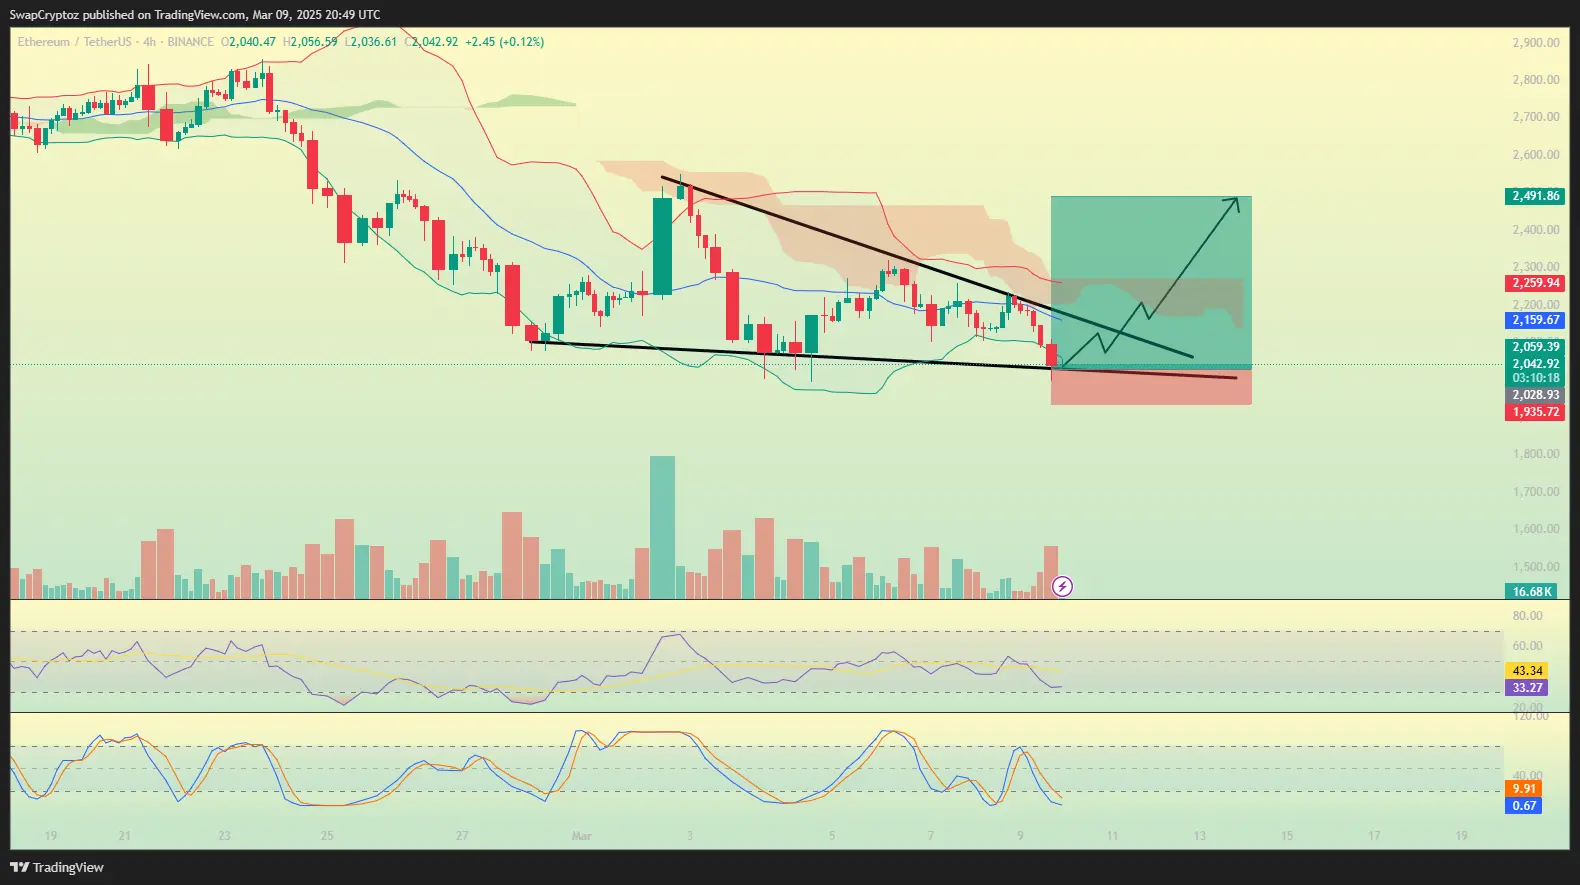
BNB has broken out of a falling wedge on the 4H chart, signaling strong bullish potential. Price is now trading above the Ichimoku cloud, confirming trend strength, with rising volume backing the move. RSI around 44 shows recovery from oversold territory, while the stochastic is cooling slightly after an overbought bounce—indicating a possible small pullback before continuation. If momentum holds, a climb toward higher levels looks likely.
🎯 Entry: 750.33
💰 TP1: 796.73
💰 TP2: 812.93
🎯 TP3: 861.04
🛡️ Stop Loss (SL): 720.47
RLY2.65%
BNB1.07%
CLOUD1.56%
MOVE1.51%
  • Reward
  • Comment
  • Repost
  • Share
#GALAUSDT# – Back in the Golden Zone 🟡📉 Ready for a Bullish Comeback?
As we step into August 2025, Gala Games is once again trading within the opportunity buy zone — a price area that just weeks ago felt like a missed chance. After two red weeks, market sentiment is quiet… but this silence might be the calm before the storm.
GALA is currently sitting at one of its lowest historical levels — quite literally rock bottom. While many ignore this zone now, smart investors recognize it as the perfect moment to quietly accumulate. With five full months left in the year and our late 2025 bull market
READY-0.57%
STEP-3.89%
STORM2.38%
post-image
  • Reward
  • Comment
  • Repost
  • Share
if ADA coin Brake this resistance line then ADA coin can pump almost 25%
ADA1.92%
PUMP-6.98%
post-image
  • Reward
  • Comment
  • Repost
  • Share
COMP/USDT – Wedge Breakout Could Spark a Big Rally
COMP/USDT is trading within a tightening wedge pattern, supported by rising trendlines and facing a descending resistance. RSI sits at 51.66, indicating neutral momentum, while stochastic RSI is in the oversold zone, hinting at an upward push. Bollinger Bands are narrowing, suggesting a strong upcoming move. If price bounces from support, a scalping trade could deliver quick gains, but a confirmed breakout above the wedge may trigger a massive rally.
Entry: $42.58 or $41.51
1st TP: $51.73
2nd TP: $59.48
3rd TP: $76.67
4th TP: $101.79
Stop
COMP11.81%
SPK-0.5%
RLY2.65%
MOVE1.51%
  • Reward
  • Comment
  • Repost
  • Share
Bitcoin Testing Key Resistance Near $120K – Breakout or Rejection Incoming?
The #BTCUSDT# daily chart shows Bitcoin consolidating just below the major $120K resistance zone after a strong bullish move. Price is currently moving sideways inside a tight range, forming a mini accumulation zone. This is often a signal of a potential breakout or rejection depending on incoming volume and sentiment. The price is still above the Ichimoku Cloud, showing underlying bullish structure. Bollinger Bands are squeezing, hinting at upcoming volatility.
RSI is cooling off from overbought levels, while the Stoc
MAJOR-1.13%
MOVE1.51%
CLOUD1.56%
post-image
  • Reward
  • Comment
  • Repost
  • Share
This BTC/USDT 4-hour chart shows a symmetrical triangle pattern, indicating potential volatility ahead. Price is consolidating, and a breakout could lead to a sharp move toward $90,000 or lower support. Indicators suggest weakening momentum. So I'm Bullish on BTC .
MOVE1.51%
post-image
  • Reward
  • Comment
  • Repost
  • Share
This ETH/USDT 4-hour chart shows a descending wedge pattern, suggesting a potential bullish breakout. The price is testing the lower trendline, indicating a possible reversal toward $2,491. Indicators show oversold conditions, hinting at a recovery. A breakout above resistance could confirm an uptrend, while a breakdown may lead to further losses.
ETH6.58%
post-image
  • Reward
  • Comment
  • Repost
  • Share
The ETH/USDT 1-hour chart shows a breakout from a symmetrical triangle pattern, indicating a potential bullish trend. The price has moved above the resistance level, suggesting further upward momentum with a target of $2,520. A stop-loss is placed at $2,110 to manage risk. The technical indicators, including RSI and Stochastic, show strong bullish momentum, supporting the breakout. If the price sustains above the breakout zone, further gains are expected in the coming sessions.
ETH6.58%
STRONG5.77%
post-image
  • Reward
  • Comment
  • Repost
  • Share
TRUMP Coin Analysis !
!Signal : Long
Coin Name : $TRUMP
Entry: 15.26
1st Tp: 16.81
2nd Tp: 17.61
3rd Tp : 18.39
SL: 14.47
TRUMP1.76%
  • Reward
  • Comment
  • Repost
  • Share
ETH UPDATE !!
Ethereum (ETH) is setting up for a potential breakout from a triangular pattern, targeting a 15.23% gain with resistance at 409.65 (40,965). RSI indicates neutral conditions.
Trade Details:
📍 Entry: 2694.44
🎯 1st TP: 2863.94
🎯 2nd TP: 2969.88
🎯 3rd TP: 3102.30
⛔ SL: 2506.39
ETH6.58%
  • Reward
  • Comment
  • Repost
  • Share
Doge Short Position:
Entry: 0.2763
Targets:
1st TP: 0.2635
2nd TP: 0.2582
3rd TP: 0.2544
Stop Loss: 0.28229
Leverage: 30x
Risk: 2% of total capital
DOGE4.87%
  • Reward
  • Comment
  • Repost
  • Share
  • Topic
  • Pin
Trade Crypto Anywhere Anytime
qrCode
Scan to download Gate app
Community
English
  • 简体中文
  • English
  • Tiếng Việt
  • 繁體中文
  • Español
  • Русский
  • Français (Afrique)
  • Português (Portugal)
  • Bahasa Indonesia
  • 日本語
  • بالعربية
  • Українська
  • Português (Brasil)